

What happens in memory when you create a new Java object?
/f/151162/968x1400/b44cd0384b/mats-va.jpg)
/f/151162/1200x1200/059d42605a/storyboard-what-happens-in-memory-when-you-create-a-new-java-object.png)
It has been a while since I last wrote Java. In my current role, I spend most of my time writing SQL and Python. While I appreciate both, Java has always felt like home. It's the coding language I first tried out when I was about 16 years old. So, naturally, on the second day of my two-week vacation, boredom set in. What do you do? You launch your favorite game: IntelliJ! And then what?... After building the same boring CRUD applications, you fall into a black hole and wonder: "What should I code next?". I created a new class called Order. Muscle memory, I guess. Nothing too fancy. Just a standard entity with some everyday fields:
Java
public class Order {
long id;
int quantity;
BigDecimal price;
String customer;
List<Item> items;
}
Then came the line that brings an Order to life:
Java
Order myOrder = new Order();
And then I stopped. I stared at that single, familiar line of code for a solid 5 minutes. I’ve written it a million times, but suddenly I asked myself: "What are you? Who are you? What happens when I run this code?". Boy oh boy, did this question send me on a date with the Java Virtual Machine (JVM) and memory theory.
A quick search online didn't provide me with lots of information. I was left with the standard textbook explanation:
When a new object is created through a constructor, Java allocates memory for that object in the heap. Its fields will also be initialized with their default values. The reference to the object will be placed on the stack.
Cool. Very academic. But how does it look like underneath the code? I tried pulling out the Java standard Reflection API. But, I was left empty-handed. Java is built to protect you from the abstract. Its core premise has always been: "Write once, run anywhere". This basically means: We are going to put a massive wall between you and your computer's memory so you don't blow things up. This gives us, the programmers, the luxury of not worrying about memory management.
If I wanted to see what is underneath the hood, I had to stop asking Java politely. I had to break it down.
Heap and Stack
A great place to start is with something you probably already know: objects, the heap, and the stack. Let's take a closer look at them.
A quick note about memory
Both the stack and the heap are parts of virtual memory. This means that the addresses we talk about aren't actual locations in your computer's RAM. Instead, the Memory Management Unit (MMU) translates these virtual addresses into physical addresses in RAM. For the rest of this blog, we don't really need to worry about that distinction. So when I say "memory", "address", "stack", or "heap", I'm talking about their virtual memory representation.
The Stack
The stack is a small and very fast area of memory that works like a stack of plates: last in, first out (LIFO). The Java Virtual Machine (JVM) creates a separate stack for each thread. Our examples only use one thread, so we'll simply call it the stack. Whenever a method is called, the JVM creates a stack frame for that method and pushes it onto the stack. The frame contains things such as local primitive variables and references to objects. When the method returns, its frame is removed from the stack. This also explains why endless recursion can cause a StackOverflowError. Every recursive method call adds another frame to the stack. Eventually, there isn't enough stack space left for another frame.
The Heap
Unlike the stack, the heap is much larger, but accessing it is generally more expensive. This is where you'll find things like object instances, arrays, and larger data structures. An object doesn't disappear just because the method that created it has finished. It remains on the heap until the Garbage Collector (GC) decides its time is up.
Alright, knowing this. I jumped back to my code:
Java
Order myOrder = new Order();
The variable myOrder sitting on the stack isn't the Order instance itself. It's a reference, referring to the heap, where the actual Order data lives. (References do not always reside in the stack. But, for simplicity, we'll keep it there).
A new question came up: "So, if this Order instance lives on the heap, where exactly on the heap? What does it look like?". Native Java couldn't give me an answer now. I wanted to see my Order object. I wanted to meet it. To find out, I hoisted an old buddy out of a dungeon of whom I thought I'd never see again: the C-programming language.
C Language, my savior
Unlike Java, C doesn't try to protect your feelings. It assumes you are an adult who knows exactly what you are doing... We don't. What you write in C is almost identical with what lives in memory.
I basically rewrote my Java code in the C-programming language and played around with it to see if I could become any smarter. I translated our Java Order class into C structs:
C/C++
struct BigDecimal {
    double price;
};


struct Item {
    int itemId;
    char *itemName;
    struct BigDecimal *price;
};


struct ItemList {
    struct Item **items;
    size_t size;
    size_t capacity;
};


struct Order {
    long id;
    int quantity;
    struct BigDecimal *price;
    char *customer;
    struct ItemList *items;
};
Ugh, isn't C beautiful? Now, let's instantiate Order in C and do something Java strictly forbids: print its raw memory address.
There you are!
Our Order instance is alive. But where does it live? I wanted to meet it. Luckily C gives you some handy operators to let us look directly at the memory:
C/C++
int main(void)
{
    struct Order *myOrder = malloc(sizeof(struct Order));
    printf("Pointer's address on Stack:          0x%p\n", (void *)&myOrder);
    printf("Pointer value as address:            0x%p\n", (void *)myOrder);
    return 0;
}
Run this, and you get something like:
None
Pointer's address on Stack:          0x0000007DC13FFC58
Pointer value as address:            0x0000022C718FD210
We're looking at two addresses here. I know, this doesn't look like the address of where your crush lives. But I was excited. With the '&' operator, we can take a look at pointers. It returns the memory address of where something lives in memory. So myOrder would show the address where the Order instance lives on the heap. &myOrder shows the address of where the reference variable myOrder lives on the stack.
What does 0x0000022C718FD210 actually mean? Think of memory as a gigantic sequence of numbered bytes:
None
0x0000022C718FD20E
0x0000022C718FD20F
0x0000022C718FD210 <-- myOrder starts at this memory address.
0x0000022C718FD211
0x0000022C718FD212
myOrder starts at address 0x0000022C718FD210. I say start because this address isn't the content of myOrder. It's the location of where it begins. Now it started to become fun. I'll give you an example:
Suppose our Order struct is 32 bytes in total size. That means its data is stored continuously across 32 sequential byte slots in memory. Let's do the hex math to find its exact boundary:
None
tart address: 0x0000022C718FD210
Size: 32 bytes = 0x20 in hexadecimal
Next free address = 0x0000022C718FD210 + 0x20 = 0x0000022C718FD230
Because address 0x0000022C718FD230 is where the next block of memory begins, our 32 byte struct occupies every single byte from 0x0000022C718FD210 through 0x0000022C718FD22F. When the CPU reads those 32 bytes, it has everything it needs to assemble myOrder. Though, I wouldn't be a tester if I couldn't prove my point visually to you.
Let's extend our C-code a little bit more. Let's look at the memory address of all the struct members:
C/C++
int main(void) {
    struct Order *myOrder = malloc(sizeof(struct Order));

    printf("Starting memory address of myOrder:  %p\n", (void *)myOrder);
    printf("Starting memory address of id:       %p\n", (void *)&myOrder->id);
    printf("Starting memory address of quantity: %p\n", (void *)&myOrder->quantity);
    printf("Starting memory address of price:    %p\n", (void *)&myOrder->price);
    printf("Starting memory address of customer: %p\n", (void *)&myOrder->customer);
    printf("Starting memory address of items:    %p\n", (void *)&myOrder->items);

    return 0;

};
Output:
None
Starting memory address of myOrder:  00000173E4FDD180
Starting memory address of id:       00000173E4FDD180
Starting memory address of quantity: 00000173E4FDD184
Starting memory address of price:    00000173E4FDD188
Starting memory address of customer: 00000173E4FDD190
Starting memory address of items:    00000173E4FDD198
Every struct member has its own distinct address in memory. Notice how id and myOrder share the exact same starting point: 0x00000173E4FDD180. It marks the beginning of our myOrder struct, making it the memory address for id as well, since id is the very first member.
To figure out how much space each field occupies, we simply calculate the byte difference between sequential addresses:
None
- id -> quantity:       00000173E4FDD184 - 00000173E4FDD180 = 4 bytes.
- quantity -> price:    00000173E4FDD188 - 00000173E4FDD184 = 4 bytes.
- price -> customer:    00000173E4FDD190 - 00000173E4FDD188 = 8 bytes.
- customer -> items:    00000173E4FDD198 - 00000173E4FDD190 = 8 bytes.
- items -> ???:         ??? - 00000173E4FDD190 = ??? bytes.
Hmm... we ran into a small problem with the last member. We don't have a member after items to subtract from, so we don't know where the member items ends. Luckily, we can solve this with a bit of subtraction. So far, we have accounted for 24 bytes (4 + 4 + 8 + 8). If we can figure out the total size of struct Order in memory, we can subtract those 24 known bytes to find the size of the member items. C provides an operator for exactly this: sizeof.
C/C++
int main(void) {
    printf("Total struct size: %zu bytes\n", sizeof(struct Order));
    return 0;
}
Running this prints: Total struct size: 32 bytes
Doing the math: 32 - 24 = 8. Hooray! That means the struct member items takes up 8 bytes. Adding 8 (0x8) to its starting address 0x00000173E4FDD198 gives us 0x00000173E4FDD1A0 the address marking the end of our struct! But...
Doing hexadecimal subtraction in our heads every time we want to locate a member is... exhausting. These raw addresses show us exactly where data lives, but let's be honest: staring at strings of hex digits gets overwhelming fast. On top of that, every time you run the code, the addresses change. There is a way to see how a struct is organized without doing manual hex math: offsetof. An offset simply measures the distance in bytes from the very start of a struct (byte 0) to the start of a specific member field. I'll show you:
C/C++
int main(void) {
    printf("Bytes between struct start address and id start address: %zu\n", offsetof(struct Order, id));
    printf("Bytes between struct start address and quantity start address: %zu\n", offsetof(struct Order, quantity));
    printf("Bytes between struct start address and price start address: %zu\n", offsetof(struct Order, price));
    printf("Bytes between struct start address and customer start address: %zu\n", offsetof(struct Order, customer));
    printf("Bytes between struct start address and items start address: %zu\n", offsetof(struct Order, items));
    return 0;
};
Output:
None
Bytes between struct start address and id start address: 0
Bytes between struct start address and quantity start address: 4
Bytes between struct start address and price start address: 8
Bytes between struct start address and customer start address: 16
Bytes between struct start address and items start address: 24
Look how clearly that maps out!
The member id sits right at the front (0). The member quantity begins 4 bytes in. Member price starts at byte 8. Member customer jumps to byte 16, and items starts at byte 24. Since items is an 8 byte pointer, it spans from byte 24 through byte 31. This brings the grand total to 32 bytes.
Java doesn’t play by C’s rules
After this little experiment in C, I wondered if Java works the same. I jumped back into IntelliJ, ready to prove that Java layout works just like C layout. But as we found out earlier, Java's Reflection API won't tell you field offsets. So I decided to bypass the JVM's security wall entirely.
sun.misc.Unsafe
Deep inside the Java Development Kit (JDK) lies a class that standard developers were never meant to touch: sun.misc.Unsafe. Its name is not a metaphor. It is an internal API that gives Java code raw pointer arithmetic, direct heap allocation, and powers to bypass reflection. This class is a recipe for disaster. It breaks the fundamental safety guarantees that make Java... Java. Sounds like big funsies to me. Let's summon Unsafe!
If you try to call upon Unsafe directly in your application code, the JVM throws a security exception. This is because your code wasn't loaded by the Bootstrap ClassLoader (loads the fundamental, trusted core Java runtime classes like Object, String and System).
In order to reach Unsafe, we'll have to use standard Java reflection:
Java
class Main {
    static void main(String[] args) throws NoSuchFieldException, IllegalAccessException {
        Field unsafeField = Unsafe.class.getDeclaredField("theUnsafe");
        unsafeField.setAccessible(true);
        Unsafe unsafe = (Unsafe) unsafeField.get(null);
    }
}
Now that we hold the keys to the kingdom, let's print out the exact byte offsets of our Java Order fields:
Java
for (Field field : Order.class.getDeclaredFields()) {
    long offset = unsafe.objectFieldOffset(field);
    System.out.printf("Offset for field: %s: %d%n", field.getName(), offset);
}
I ran the code, and waited for the same output we had in C... Here's what I got:
None
Offset for field: id: 16
Offset for field: quantity: 12
Offset for field: price: 24
Offset for field: customer: 28
Offset for field: items: 32
I stared at the output with frowning eyebrows. Two massive abnormalities caught my eye:
Where is 0? In C, the first field (id) started at offset 0. But in Java, the very first field (which is quantity for some reason) doesn't start until byte 12!
The order is not the same. In the Java code, I declared id first, and quantity second. But the JVM put quantity at offset 12, and pushed id down to offset 16. In C, the order followed the order I declared in the code.
To me, those were 2 new questions to be answered. We'll dive into the first one first.
HotSpot and the Object Header
As it turns out, the JVM has a standard engine running underneath the hood, HotSpot. It manages thread stacks, allocates objects on the heap, Garbage Collection, Class Loading, ...
In C, a struct is just raw data. A C program relies on the compiler knowing at compile-time what type a memory block is. C doesn't attach metadata to its memory.
Java, however, promises type safety, garbage collection, dynamic method dispatch, and object locking. To deliver those features, a place is needed to keep all this metadata and state. Imagine if Java developers tried to do this the naive way: by adding separate hidden fields to every class you write. You’d end up paying a massive, hidden memory tax on every single object in your heap!
To avoid that, HotSpot attaches a 12 byte Object Header to the front of every heap object. This header is split into two distinct parts: The Mark Word, and the Compressed Class Pointer.
Rather than allocating separate memory for locks, hash codes, and garbage collection age, HotSpot packs all of that state into this single 8 byte Mark Word. It is completely "multipurpose". Let's dissect this header layer by layer, straight into the Mark Word and Compressed Class Pointer.
Part 1: Mark Word
The Mark Word is an 8 byte part of the 12 byte Object Header. Those 8 bytes follow a certain layout to be able to provide some responsibilities. We can find the exact information on how the layout looks like in the official JVM Source Code Definition: (https://github.com/openjdk/jdk/blob/master/src/hotspot/share/oops/markWord.hpp).
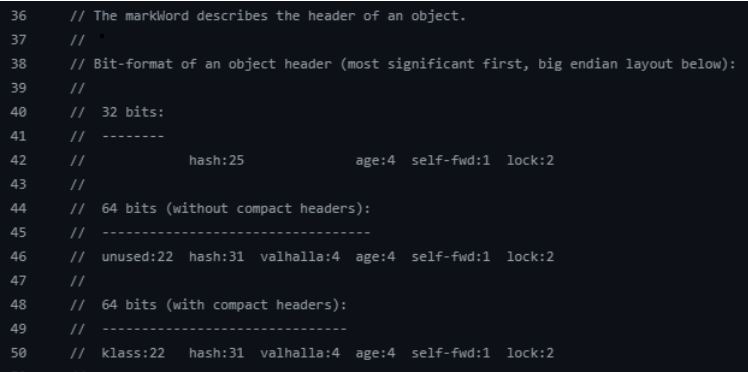 When you look the official JVM Source Code Definition, you see that there are 2 options. Both 64 bit but either with or without Compact Object Headers. To keep it short: Compact Object Headers is a huge architectural change that shrinks Java Object Headers from 12 bytes to 8 bytes total. This update will be default with the JDK 27, releasing on September 15, 2026. Since my code is running on JDK 25, it's not turned on by default. This gives us the following layout and responsibilities:
Lock State (Bits 0–1): Tracks synchronization status.
Self-Forwarded Bit (Bit 2): Used during Garbage Collection (GC) compacting cycles to signal an object being relocated in memory.
GC Age (Bits 3–6): A 4-bit part tracking how many GC survival rounds this object has lived through.
Valhalla Flags (Bits 7–10): Reserved for upcoming Project Valhalla enhancements to distinguish Identity Objects from Value Objects.
Identity Hash Code (Bits 11–41): A 31-bit slot holding the object's identity hash code, computed lazily.
That's 42 bits in total. Since the Mark Word is 8 byte, that means there are 64 bits. What are the other 22 bits used for? Until JDK 27 they were by default empty. Deliberately reserved for architectural flexibility, alignment, and performance.
Again, I wouldn't be a tester if I cannot provide you with proof. We'll use Unsafe again to check out if this theory is correct.
Proof
Let's test this in code. We'll start simple by using Unsafe to read the first 8 bytes of our Order object at offset 0:
Java
long objectHeader = unsafe.getLong(myOrder, 0L);
System.out.printf("Object Header: 0x%016X%n", objectHeader);
Running this returns a surprisingly boring result:
None
Object Header: 0x0000000000000001
The value 0x0000000000000001 tells us that the object is currently in the unlocked state. The remaining bits are unset: no identity hash code has been recorded, and the GC age is zero. So far, there's nothing particularly interesting in the Mark Word. Let's make the JVM change it. One way to do that is to force the JVM to calculate the object's identity hash code. We can try putting the object into a HashMap and see whether that changes the Mark Word:
Java
Order myOrder = new Order();
long objectHeaderBefore = unsafe.getLong(myOrder, 0L);
System.out.printf("Object Header (BEFORE): 0x%016X%n", objectHeaderBefore);

Map<String, Order> orderMap = new HashMap<>();
myOrder.customer = "New customer";
orderMap.put("first customer", myOrder);

long objectHeaderAfter = unsafe.getLong(myOrder, 0L);
System.out.printf("Object Header (AFTER): 0x%016X%n", objectHeaderAfter);
When you run this, you get another surprise:
None
Object Header (BEFORE): 0x0000000000000001
Object Header (AFTER): 0x0000000000000001
Nothing happened. Why? Because in a HashMap, only the Key is hashed. Since myOrder was stored as the Value, its hashcode was never queried! Let's force the JVM to compute the Identity Hash Code directly using System.identityHashCode(myOrder):
Java
Order myOrder = new Order();
    long objectHeaderBefore = unsafe.getLong(myOrder, 0L);
    System.out.printf("Object Header (BEFORE): 0x%016X%n", objectHeaderBefore);

    System.identityHashCode(myOrder);
    long objectHeaderAfter = unsafe.getLong(myOrder, 0L);
    System.out.printf("Object Header (AFTER): 0x%016X%n", objectHeaderAfter);
Ta-da!:
None
Object Header (BEFORE): 0x0000000000000001
Object Header (AFTER): 0x0000018DF7ECF801
The header instantly changed! The JVM wrote the newly generated hashcode right into the Mark Word. Now, can we extract that raw bit pattern directly out of the Mark Word and prove it matches System.identityHashCode()? According to the OpenJDK JVM source code, the 31 bit Identity Hash Code sits across bits 11 through 41 inside the 64 bit Mark Word bitfield. To isolate those exact 31 bits we have to use some complex techniques: shifting and applying bit masks.
We shift the bits 11 times to the right to drop the first 11 lower (Lock state, GC Age, Valhalla flags, ...). Now we still have the 22 bits that hover above our Identity Hash Code that could possibly corrupt our answer. So we cut them off by using a bitwise AND mask 0x7FFFFFFF. It's basically saying: wipe out the 22 bits to the left.
Java
Order myOrder = new Order();

    long objectHeaderBefore = unsafe.getLong(myOrder, 0L);
    System.out.printf("Object Header (BEFORE): 0x%016X%n", objectHeaderBefore);

    int generatedIdentityHashCode = System.identityHashCode(myOrder);
    System.out.printf("Generated Identity Hash Code: %d (0x%08X)%n", generatedIdentityHashCode, generatedIdentityHashCode);

    long markWord = unsafe.getLong(myOrder, 0L);
    long extractedHash = (markWord >>> 11) & 0x7FFFFFFF;

    System.out.printf("Object Header (AFTER): 0x%016X%n", markWord);
    System.out.printf("Extracted Identity Hash Code: %d (0x%08X)%n", extractedHash, extractedHash);
Look at the output:
None
Object Header (BEFORE): 0x0000000000000001
Generated Identity Hash Code: 834600351 (0x31BEFD9F)
Object Header (AFTER): 0x0000018DF7ECF801
Extracted Identity Hash Code: 834600351 (0x31BEFD9F)
It matches down to the exact hex byte! Using this exact same shifting and masking technique, we can dissect the entire 64 bit Mark Word field by field:
Java
int generatedHash = System.identityHashCode(myOrder);
long markWord = unsafe.getLong(myOrder, 0L);
long lockState = markWord & 0x3L;
long selfFwd = (markWord >>> 2) & 0x1L;
long gcAge = (markWord >>> 3) & 0xFL;
long valhallaBits = (markWord >>> 7) & 0xFL;
long extractedHash = (markWord >>> 11) & 0x7FFFFFFF;
long unusedBits = (markWord >>> 42) & 0x3FFFFFL;

System.out.printf("Raw Mark Word         : 0x%016X%n", markWord);
System.out.printf("Lock Bits (0-1)       : %d (0x%X)%n", lockState, lockState);
System.out.printf("Self-Forwarded (2)    : %d (0x%X)%n", selfFwd, selfFwd);
System.out.printf("GC Age (3-6)          : %d (0x%X)%n", gcAge, gcAge);
System.out.printf("Valhalla (7-10)       : %d (0x%X)%n", valhallaBits, valhallaBits);
System.out.printf("Generated Hash (11-41): %d (0x%08X)%n", generatedHash, generatedHash);
System.out.printf("Extracted Hash (11-41): %d (0x%08X)%n", extractedHash, extractedHash);
System.out.printf("Unused Bits (42-63)   : 0x%06X%n", unusedBits);
Part 2: Compressed Class Pointer
Right after the 8-byte Mark Word sits the Compressed Class Pointer. Taking up exactly 4 bytes (32 bits), this field acts as a memory bridge: it connects our specific object instance on the heap directly to its class metadata stored in memory. This way the JVM knows exactly what type an object is. We've already seen how to grab a part of memory. Let's grab the Compressed Class Pointer of our object myOrder by using the offset 8 (right after the Mark Word):
Java
int classPointerMyOrder = unsafe.getInt(myOrder, 8);
The result is:
None
0x01042A10
Proof
Now, how do we know that this value leads to the class Order? Easy, by creating a new Order instance, grab its Compressed Class Pointer and compare the values. On top of that we'll do the same test with a String object and compare it with our Order Compressed Class Pointer:
Java
Order myOrder = new Order();
    int classPointer = unsafe.getInt(myOrder, 8);
    System.out.printf("class pointer Order: 0x%08X%n", classPointer);

    Order newOrder = new Order();
    int classPointerNewOrder = unsafe.getInt(newOrder, 8);
    System.out.printf("class pointer other Order: 0x%08X%n", classPointerNewOrder);

    String myString = "myString";
    int stringClassPointer = unsafe.getInt(myString, 8);
    System.out.printf("class pointer String: 0x%08X%n", stringClassPointer);

    String newString = "newString";
    int newStringClassPointer = unsafe.getInt(newString, 8);
    System.out.printf("class pointer other String: 0x%08X%n", newStringClassPointer);
The result proves the theory:
None
class pointer Order: 0x01042A10
class pointer other Order: 0x01042A10
class pointer String: 0x001884E8
class pointer other String: 0x001884E8
Both the Order objects have the same value, and so do the String objects. Great Success! No matter how many millions of Order instances you instantiate, every single one carries the exact same 4-byte Order.class blueprint.
CPU Alignment & Field Optimization
By playing around with Unsafe and taking inspiration from C, we've solved the 12 byte void question: Bytes 0-7 is the Mark Word and bytes 8-11 the Compressed Class Pointer. This is why Order field offsets started at byte 12. Remember the answer?:
None
Offset for field: id: 16
Offset for field: quantity: 12
Offset for field: price: 24
Offset for field: customer: 28
Offset for field: items: 32
But our deep dive isn't over yet. We still haven't answered the second question that threw us off earlier: “Why did the JVM take the quantity field (declared second) and move it ahead of id (declared first) to offset 12?”
To understand why HotSpot doesn't necessarily place your fields in the order you wrote them, you have to take off your developer hat and put on your CPU hat.
Let's look at one important property of modern CPUs: memory alignment. Multibyte values are generally most efficient to access when they are stored at naturally aligned addresses. For example:
A 2-byte short starts at an address divisible by 2.
A 4-byte int or float starts at an address divisible by 4.
An 8-byte long, double or 8-byte pointer starts at an address divisible by 8.
Example:
Consider an 8-byte long starting at address 13:
Memory Address 13 14 15 16 17 18 19 20
8-byte long primitive B0 B1 B2 B3 B4 B5 B6 B7
The value crosses an 8-byte alignment boundary at address 16. Access like this is unaligned. If the same value starts at address 16, it is naturally aligned:
Memory Address 16 17 18 19 20 21 22 23
8-byte long primitive B0 B1 B2 B3 B4 B5 B6 B7
So to save lots of CPU time and memory space, the fields of Order.class should be in a well considered order. If HotSpot had respected our code and placed id (8 bytes long) at offset 12, it would have created a misaligned memory access. Some architectures or for some instructions, it may not even be allowed. To fix that, HotSpot would have had to leave 4 empty "dead bytes" at offset 12 to push id down to byte 16.
Instead of trashing those 4 bytes, HotSpot scanned the Order class, found the 4 byte quantity field, which is an int, and pushed it right into offset 12.
HotSpot's Field Layout
HotSpot doesn't just order fields randomly. Its layout takes field size, alignment, inheritance, references, and other JVM-specific considerations into account when deciding where each field goes.
A simplified view of the layout we're interested in looks something like this:
12-byte Object Header
long / double
int / float
short / char
byte / boolean
pointers to objects
But? Huh? This order doesn't make sense. If we remember our result the field quantity, which is an int comes before id, which is a long? This is against the order... That's because Gap Filling takes over. Before dumping the 8 byte primitives behind the Object Header, HotSpot checks if the Object Header leaves a 4 byte hole (or dead bytes) at offset 12. If it does, HotSpot scans the Order class for an int, or a float, or a 4 byte Compressed Reference to fill the gap first.
We can test this by creating a new class with a good mix of primitives. We'll call it Chaos:
Java
public class Chaos {
    byte a;
    long b;
    short c;
    int d;
    boolean e;
    double f;
    Object g;
    float h;
}
To check how HotSpot orders the fields of Chaos.class, we'll print the offsets, using Unsafe:
Java
Chaos chaos = new Chaos();
    for(Field chaosField : chaos.getClass().getDeclaredFields()) {
        String fieldName = chaosField.getName();
        Class<?> type = chaosField.getType();
        long offset = unsafe.objectFieldOffset(chaosField);
        System.out.printf("Field %s with type %s has offset: %d%n", fieldName, type, offset);
    }
Here is the object layout that HotSpot generates:
None
Field a with type byte has offset: 38
Field b with type long has offset: 16
Field c with type short has offset: 36
Field d with type int has offset: 12
Field e with type boolean has offset: 39
Field f with type double has offset: 24
Field g with type class java.lang.Object has offset: 40
Field h with type float has offset: 32
Look at how HotSpot organized the Chaos class:
d, which is an int, is the first field after the Object Header. It's because 4 bytes were empty. So HotSpot scooped up field d to place it right in front. Why not field h, which is a float? They're both 4 bytes. HotSpot just picks up the first 4 byte field. If we'd declare h before d, then h would have been picked up.
HotSpot packed all small primitives (a, c and e) together at 36,38,39. Where's 37? Field c is a short (2 byte, so 36+37).
All 4 byte fields (d and h) are aligned on 4 byte addresses.
All 8-byte fields (b and f) are aligned on 8 byte start addresses.
References to objects are added in the back (g).
So beautiful. Zero wasted space between fields.
8 byte Alignment Padding:
Our Chaos object occupies offsets 0 through 43, which gives us 44 bytes of actual object data:
Object header: 12 bytes Field a with type byte has size: 1 byte Field b with type long has size: 8 bytes Field c with type short has size: 2 bytes Field d with type int has size: 4 bytes Field e with type boolean has size: 1 byte Field f with type double has size: 8 bytes Field g with type class java.lang.Object has size: 4 bytes Field h with type float has size: 4 bytes
Total = 44 bytes.
So why does the JVM report an object size of 48 bytes instead of 44?
Because HotSpot aligns objects to an 8 byte boundary by default. Since 44 isn't divisible by 8, HotSpot rounds the object size up to the next multiple of 8. HotSpot rounds the object size up to the next multiple of 8. This adds 4 bytes of padding (offsets 44 through 47) to our object. These four bytes don't contain another field. They're simply part of the object's allocated size. It might look like a waste, but it's a deliberate engineering trade-off: Keeping objects aligned makes object addressing and field access more predictable and efficient for the JVM and underlying hardware.
Compressed OOP:
Wait a minute. Look at field g and its size:
None
Field g with type class java.lang.Object has size: 4 bytes
Why is a reference pointer 4 bytes? I'm running this code on a 64-bit system. Shouldn't the field g be 8 bytes then? So, why is this field taking up only 4 bytes in memory? This is because of Compressed OOPs (Ordinary Object Pointers). They are, by default, turned on when your heap size is under ~32GB.
As a rule of thumb, if the maximum heap is below ~32 GB, Compressed OOPs will be enabled. But if you want to know for sure, check the flag UseCompressedOops directly. Run your Java program with the following VM-option: -XX:+PrintFlagsFinal. This will show all the flags used by the JVM. When running your code, in the log search for 'UseCompressedOops':
None
bool UseCompressedOops = true {product lp64_product} {ergonomic}
Now, imagine that every object reference took 8 bytes in memory, which would be the case on 64-bit systems. Memory usage would blow up through the roof, possibly trash some CPU caches. HotSpot has found a genius way to solve this memory bottleneck. As we discovered before: Every object on the heap is padded to 8 bytes. (8, 16, 24, ...). Let's convert those to binary values:
8: 0000 1000 16: 0001 0000 24: 0001 1000 32: 0010 0000 ...
The last 3 bits of every object's memory address are ALWAYS 000 in binary. Because the lower 3 bits are always zero, the JVM doesn't bother storing them inside reference fields. Conceptually, HotSpot takes the object's address, shifts it right by 3 bits, and stores the resulting value as the compressed reference. When the JVM needs the actual address again, it can shift the compressed value left by 3 bits to reconstruct it... I was baffled.
Conclusion
Remember that simple, innocent line of code we started with?:
Java
Order myOrder = new Order();
It's crazy to think about how much hidden engineering is packed behind that one line of code. That line of code will always remind me of what we just found out. It is no longer a black box. I was genuinely surprised by how much work the JVM does behind the scenes, and how much effort goes into making memory usage efficient.
And the cool part? So many things happen behind that simple keyword “new”.
It really comes down to this: "Write once, run anywhere" was never just about making our code work on different operating systems. The JVM provides an abstraction layer between our code and the underlying hardware, while the JVM implementation takes care of countless platform specific details and optimizations.
We get to write:
Java
new Order();
and let the JVM worry about object headers, field layout, alignment, compressed references, garbage collection, and everything else happening underneath. The JVM takes care of the hardware, letting us focus on building the software.
I guess I'll never look at new Order() the same way again. Poor thing has been carrying all that complexity this entire time.